This post compares the Total Cost of Ownership (TCO) for Lambda servers and clusters vs cloud instances with NVIDIA A100 GPUs. We first calculate the TCO for individual Lambda Hyperplane-A100 and Scalar servers and then compare the cost of renting a similarly equipped AWS EC2 p4d.24xlarge instance. We then walk through the cost of building and operating server clusters using NVIDIA A100 GPUs.
Lambda A100 servers v.s. AWS p4d.24xlarge
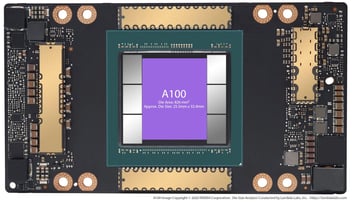
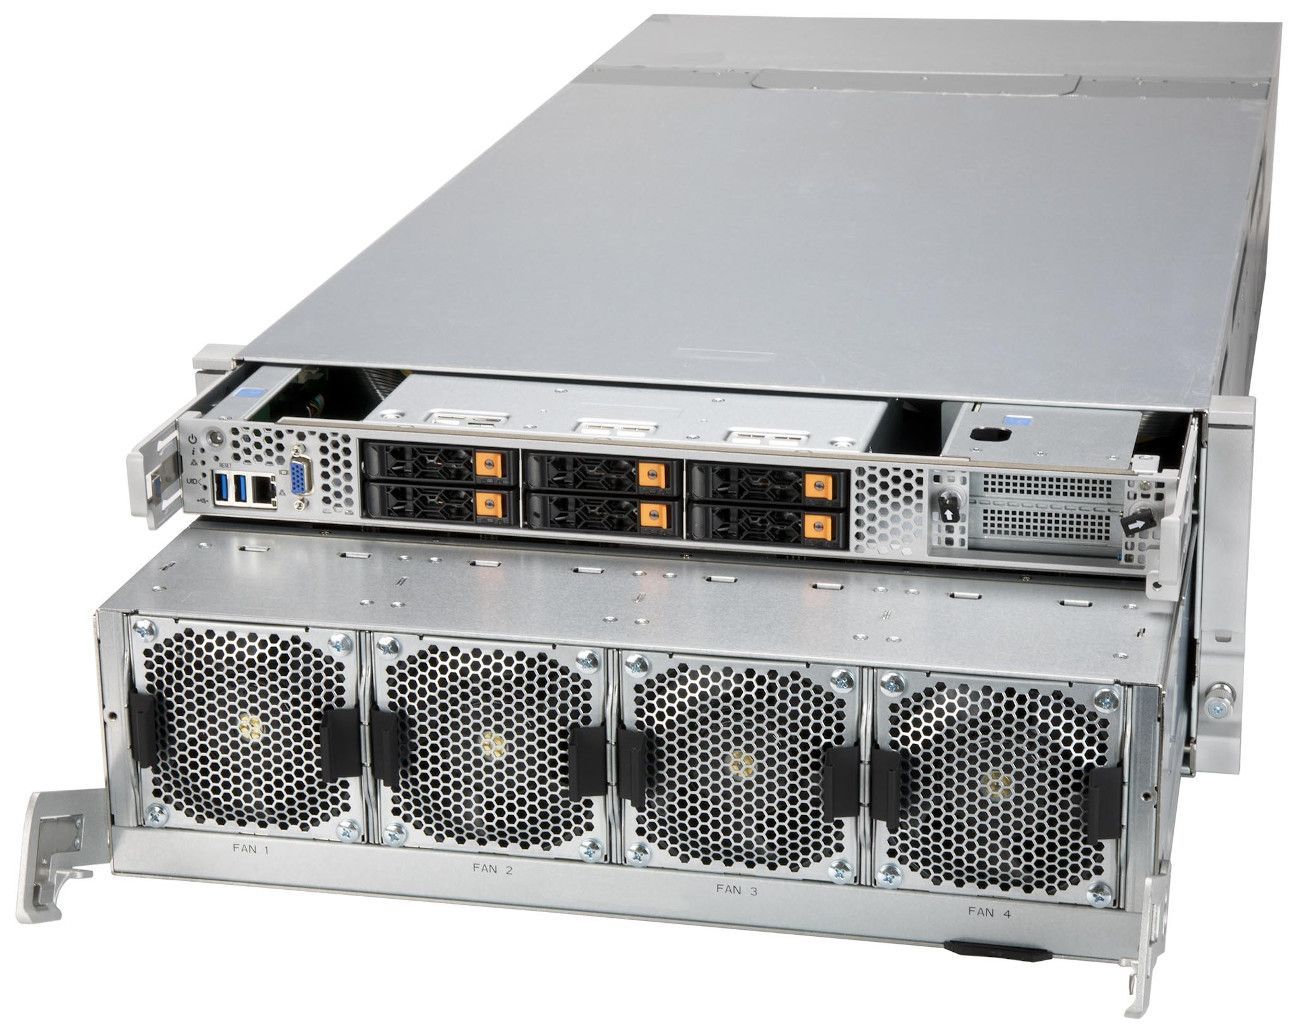
Two models of Lambda servers are available with NVIDIA Tesla A100 GPUs: Hyperplane-A100 and Scalar-A100. The main difference is how A100 GPUs are interconnected in each server. The A100 GPUs in the Hyperplane-A100 are connected via NVLink + NVSwitch. In the Scalar server, the GPUs are connected with PCIe. For this reason, the Hyperplane-A100 server scales better when multi-GPU training becomes communication-bottlenecked. More importantly, Hyperplane-A100 servers support InfiniBand (8x IB ports per server) and GPUDirect Remote Direct Memory Access (RDMA), enabling them to scale efficiently for multi-node distributed training. In addition, the A100-PCIe GPU model used in the Scalar server consumes less power than the A100-SXM4 GPU used in the Hyperplane servers (250W v.s. 400W), so they may experience a 10% throughput drop while performing machine learning tasks.
On the cloud side, the AWS EC2 p4d.24xlarge instance is similar to the eight GPU Lambda Hyperplane 8-A100. The main difference is the choice of CPU – the Hyperplane-A100 uses the latest AMD EPYC CPUs over the Intel Xeon CPUs due to their higher number of cores and PCIe 4.0 support.
Test Configurations
| Hyperplane-A100 | Scalar-A100 | p4d.24xlarge | |
|---|---|---|---|
| GPU | 8x A100-SXM4-40GB | 8x A100-PCIe-40GB | 8x A100-SXM4-40GB |
| CPU | 2x AMD EPYC 7763 (64-Core) | 2x AMD EPYC 7763 (64-Core) | Intel(R) Xeon(R) Platinum 8275CL (24-Core) |
| System Memory | 1.0 TB ECC | 1.0 TB ECC | 1.1 TB ECC |
| Storage | 15.36 TB NVMe | 15.36 TB NVMe | 8 TB NVMe |
Takeaway
We will give a walkthrough of the performance and cost analysis in later sections, but first, we need to discuss the key metric for measuring cost-effectiveness: flops/$ or flops per dollar. Flops/$ is the amount of computation you can buy with one dollar. It is calculated by dividing the total petaflops generated over a time period by the total cost of purchasing and operating the system over that same time period.
Higher flops/$ is more cost-effective. As the following two tables show, on-prem servers give significantly better flops/$ compared to cloud instances, as long as one does not scrap the value of the servers to zero after a year (100% annual depreciation).
Note that these two tables assume 50% occupancy for the on-prem and reserved cloud instances. We will have a break-even occupancy analysis later in this blog.
Flops/$ (1-yr analysis with 50% occupancy)
| Hyperplane-A100 (25% annual depreciation) | Hyperplane-A100 (100% annual depreciation) | Scalar-A100 (25% annual depreciation) | Scalar-A100 (100% annual depreciation) | p4d (qll upfront) | p4d (partial upfront) | p4d (no upfront) | p4d (on demand) | |
|---|---|---|---|---|---|---|---|---|
| Total Cost 1-yr | $55,534 | $160,534 | $47,279 | $138,779 | $164,955 | $168,321 | $176,737 | $143,544 |
| Total Petaflops 1-yr | 2,459,808 | 2,459,808 | 2,459,808 | 2,459,808 | 2,459,808 | 2,459,808 | 2,459,808 | 2,459,808 |
| Petaflops/$ | 44.3 | 15.3 | 52.0 | 17.7 | 14.9 | 14.6 | 13.9 | 17.1 |
Flops/$ (3-yr analysis with 50% occupancy)
| Hyperplane-A100 (25% annual depreciation) | Hyperplane-A100 (100% annual depreciation) | Scalar-A100 (25% annual depreciation) | Scalar-A100 (100% annual depreciation) | p4d (all upfront) | p4d (partial upfront) | p4d (no upfront) | p4d (on demand) | |
|---|---|---|---|---|---|---|---|---|
| Total Cost 3-yr | $166,602 | $201,602 | $141,837 | $172,337 | $285,893 | $304,135 | $328,473 | $430,629 |
| Total Petaflops 3-yr | 7,379,424 | 7,379,424 | 7,379,424 | 7,379,424 | 7,379,424 | 7,379,424 | 7,379,424 | 7,379,424 |
| Petaflops/$ | 44.3 | 36.6 | 52.0 | 42.8 | 25.8 | 24.3 | 22.5 | 17.1 |
Break-even Occupancy Analysis
Since an on-demand instance is billed hourly, an on-prem server solution only becomes cheaper if the time occupancy reaches a certain amount. For example, increasing occupancy from 50% to 100% will increase 1-yr petaflops/$ from 44.3 to 74.5 for a Lambda Hyperplane-A100.
We use the formula below to compute the break-even occupancy x for Lambda severs to become cheaper than the on-demand instance over a y number of years:
Annual Co-location Cost * x * y + Admin Cost * y + Upfront - Salvage Value = Annual On-demand Cost * x * y
The exact costs in the above equation can be found in the later TCO analysis. The following table shows the break-even occupancy for different servers and annual depreciation models.
Break-even Occupancy
| Hyperplane-A100 (25% annual depreciation) | Hyperplane-A100 (100% annual depreciation) | Scalar-A100 (25% annual depreciation) | Scalar-A100 (100% annual depreciation) | |
|---|---|---|---|---|
| 1-yr break-even ratio | 17% | 56% | 15% | 48% |
| 3-yr break-even ratio | 17% | 21% | 15% | 19% |
For 1-yr TCO and assuming 25% annual depreciation, a Hyperplane-A100 server is more cost-effective as long as it is occupied for 17% for the time. Even if the value of the server goes to zero after one year, a Hyperplane-A100 server is more cost-effective as long as it is utilized 56% of the time. With the Scalar-A100 server, the numbers further drop down to 15% and 48%. The break-even occupancies are the same for 1-yr and 3-yr TCO when 25% annual depreciation is used since the salvage value of the server linearly decreases with the number of years. With 100% annual depreciation, the break-even occupancies for 3-yr TCO are significantly lower than 1-yr TCO, since most of the cost is booked the first year.
TCO Analysis
We use the following formula to compute the y-yr TCO for both Lambda A100 servers:
TCO(y) = (Annual_Co-Location_Cost + Annual_Admin_Cost) * y + min(Upfront, Server_Value_Depreciation_per_year * y)
Notice the TCO for AWS instances has zero annual co-location cost, administration cost and value depreciation. We use the reference rates for a p4d.24xlarge instance to compute the upfront cost and annual rental cost for different AWS plans.
1-yr TCO with 50% occupancy
| Hyperplane-A100 (25% annual depreciation) | Hyperplane-A100 (100% annual depreciation) | Scalar-A100 (25% annual depreciation) | Scalar-A100 (100% annual depreciation) | p4d (all upfront) | p4d (partial upfront) | p4d (no upfront) | p4d (on demand) | |
|---|---|---|---|---|---|---|---|---|
| Upfront | $140,000 | $140,000 | $122,000 | $122,000 | $164,955 | $84,161 | $0 | $0 |
| Annual rental | $0 | $0 | $0 | $0 | $0 | $84,160 | $176,737 | $143,544 |
| Annual Co-Location Cost | $10,534 | $10,534 | $6,779 | $6,779 | $0 | $0 | $0 | $0 |
| Annual Admin Cost | $10,000 | $10,000 | $10,000 | $10,000 | $0 | $0 | $0 | $0 |
| Server Value Depreciation per year | $35,000 | $140,000 | $30,500 | $122,000 | $0 | $0 | $0 | $0 |
| Total Cost Over 1-yr | $55,534 | $160,534 | $47,279 | $138,779 | $164,955 | $168,321 | $176,737 | $143,544 |
3-yr TCO with 50% occupancy
| Hyperplane-A100 (25% annual depreciation) | Hyperplane-A100 (100% annual depreciation) | Scalar-A100 (25% annual depreciation) | Scalar-A100 (100% annual depreciation) | p4d (all upfront) | p4d (partial upfront) | p4d (no upfront) | p4d (on demand) | |
|---|---|---|---|---|---|---|---|---|
| Upfront | $140,000 | $140,000 | $122,000 | $122,000 | $285,893 | $152,071 | $0 | $0 |
| Annual rental | $0 | $0 | $0 | $0 | $0 | $50,688 | $109,491 | $143,544 |
| Annual Co-Location Cost | $10,534 | $10,534 | $6,779 | $6,779 | $0 | $0 | $0 | $0 |
| Annual Admin Cost | $10,000 | $10,000 | $10,000 | $10,000 | $0 | $0 | $0 | $0 |
| Server Value Depreciation per year | $35,000 | $140,000 | $30,500 | $122,000 | $0 | $0 | $0 | $0 |
| Total Cost Over 3-yr | $166,602 | $201,602 | $141,837 | $172,337 | $285,893 | $304,135 | $328,473 | $430,629 |
Assuming 50% occupancy and 25% annual value depreciation, owning a on-prem A100 server is much cheaper than renting it on AWS: Lambda Hyperplane-A100 saves 41.7% ($285,893 - $166,602 = $119,291) over a 3-yr TCO in respect to the cheapest AWS p4d.24xlarge option. Lambda Scalar-A100 enlarges the savings to 50.4% ($285,893 - $141,837 = $144,056). The gap is even larger for a 1-year TCO due to the significant amount of premium AWS charges for its 1-year reserved instances. Lambda Hyperplane-A100 saves 66.3% ($164,955 - $55,534 = $109,421) over a 1-yr TCO in respect to the cheapest reserved AWS p4d.24xlarge options, and Lambda Scalar-A100 enlarges the savings to 71.3% ($164,955 - $47,279 = $117,676).
Interestingly, the on-demand AWS instance is more cost-effective than reserved instances at the 50% occupancy rate. However, on-prem Lambda servers are still much cheaper (see the break-even occupancy analysis in the previous section).
The annual co-location cost is calculated without InfiniBand networking, storage server, management server, and rack. It assumes 50% for Power Utilization Ratio, and Co-location Cost / kWh / Month is estimated to be $350 (supported by our study of co-location cost). The main difference in co-location cost between Hyperplane-A100 and Scalar-A100 is the A100-PCIe GPUs consuming less power than the A100-SXM4 GPUs. We budget the annual administration cost for a single server to be $10,000.
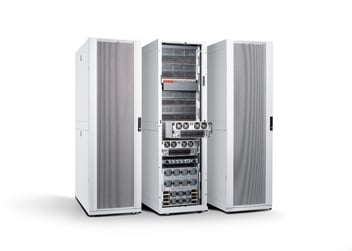
Lambda Hyperplane-A100 cluster
So far, we have discussed the TCO for a single A100 server. This assumed there is an existing cluster/cloud infrastructure to host that server. This section will examine the cost of building an on-prem A100 cluster from scratch, as well as its operation cost. The key variables in designing an on-prem GPU cluster include computing nodes, networking, storage, management node, and the design of the rack itself. Our engineers implement best practices based on Lambda's experience in building machine learning infrastructures for research institutes in both industry and academia.
The following table shows the amortized cost/year/node of InfiniBand networked Hyperplane-A100 clusters, in particular:
- InfiniBand networking
- Racks & PDUs
- System administration cost of $10,000 / year / four servers
Hyperplane-A100 Cluster with InfiniBand Networking
|
1x Cluster
|
8x Cluster
|
16x Cluster
|
|
|---|---|---|---|
| Upfront | $233,422 | $1,610,948 | $3,137,649 |
| Annual Total Operating Costs | $23,894 | $111,804 | $209,723 |
| Annual System Administration Cost | $10,000 | $20,000 | $40,000 |
| Annual Co-location Cost | $13,893 | $101,804 | $199,722 |
| Total Cost at Year 1 | $257,316 | $1,722,752 | $3,347,372 |
| Total Cost at Year 3 | $305,104 | $1,946,360 | $3,766,818 |
| Total Cost at Year 5 | $352,892 | $2,169,968 | $4,186,264 |
| Number of nodes | 1 | 8 | 16 |
| Amortized Cost / Year / Node (5 Years of Use) | $70,578 | $54,249 | $52,328 |
Similarly, the following table shows the TCO of a Scalar-A100 clusters (without InfiniBand networking and assuming distributed training is not the use case)
Scalar-A100 Cluster
|
1x Cluster
|
8x Cluster
|
16x Cluster
|
|
|---|---|---|---|
| Upfront | $161,757 | $1,028,964 | $2,025,382 |
| Annual Total Operating Costs | $16,779 | $59,084 | $107,432 |
| Annual System Administration Cost | $10,000 | $20,000 | $40,000 |
| Annual Co-location Cost | $6,779 | $49,084 | $97,432 |
| Total Cost at Year 1 | $178,536 | $1,088,048 | $2,132,814 |
| Total Cost at Year 3 | $212,094 | $1,206,216 | $2,347,678 |
| Total Cost at Year 5 | $245,652 | $1,324,384 | $2,562,542 |
| Number of nodes | 1 | 8 | 16 |
| Amortized Cost / Year / Node (5 Years of Use) | $49,130 | $33,109 | $32,031 |
The above tables compare the Hyperplane-A100 TCO and the Scalar-A100 TCO. Although Scalar-A100 clusters come at a lower upfront and operation cost, which type of A100 server should be used depends on the use cases. We recommend Hyperplane-A100 for clusters that run distributed training across multiple nodes. This is due to the superior inter-node communication of the 8 InfiniBand ports in the Hyperplane server. On the other hand, if the main use case of the cluster is inference or single-node training, the Scalar-A100 server can be a more cost-effective choice.
Performance
Last but not least, we benchmark these servers using various deep learning models and compare their training throughput in the figures below. All benchmarks used the NGC PyTorch container and can be reproduced using this repo.
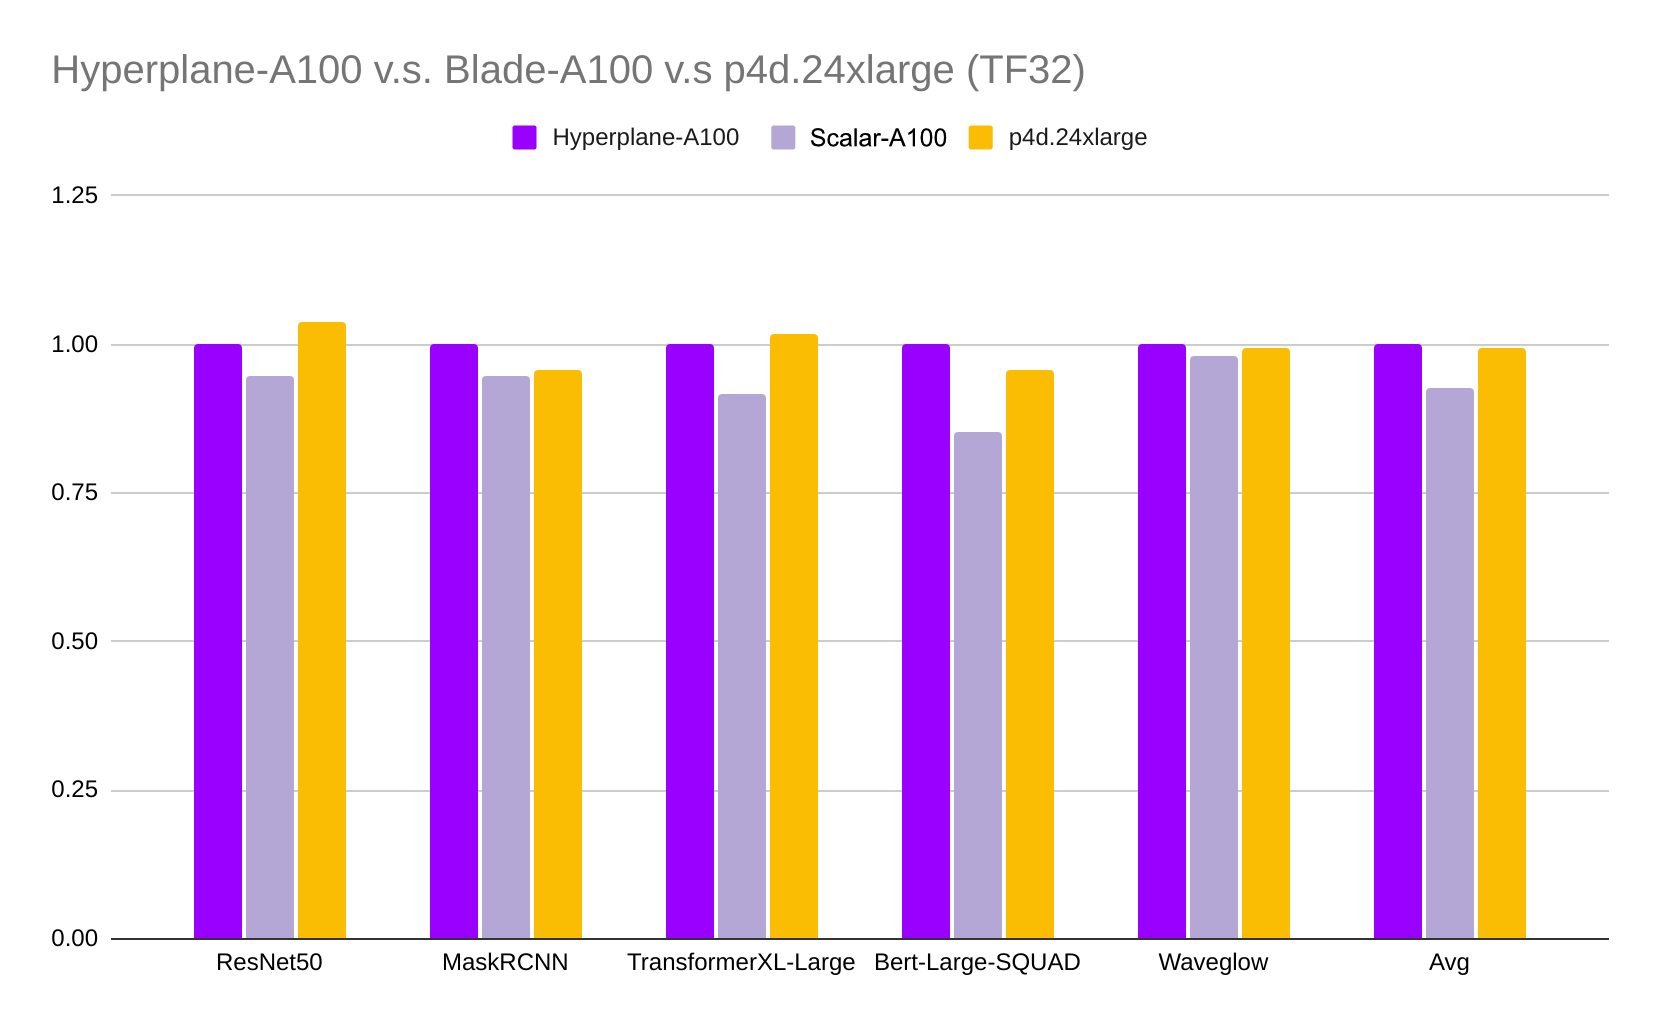
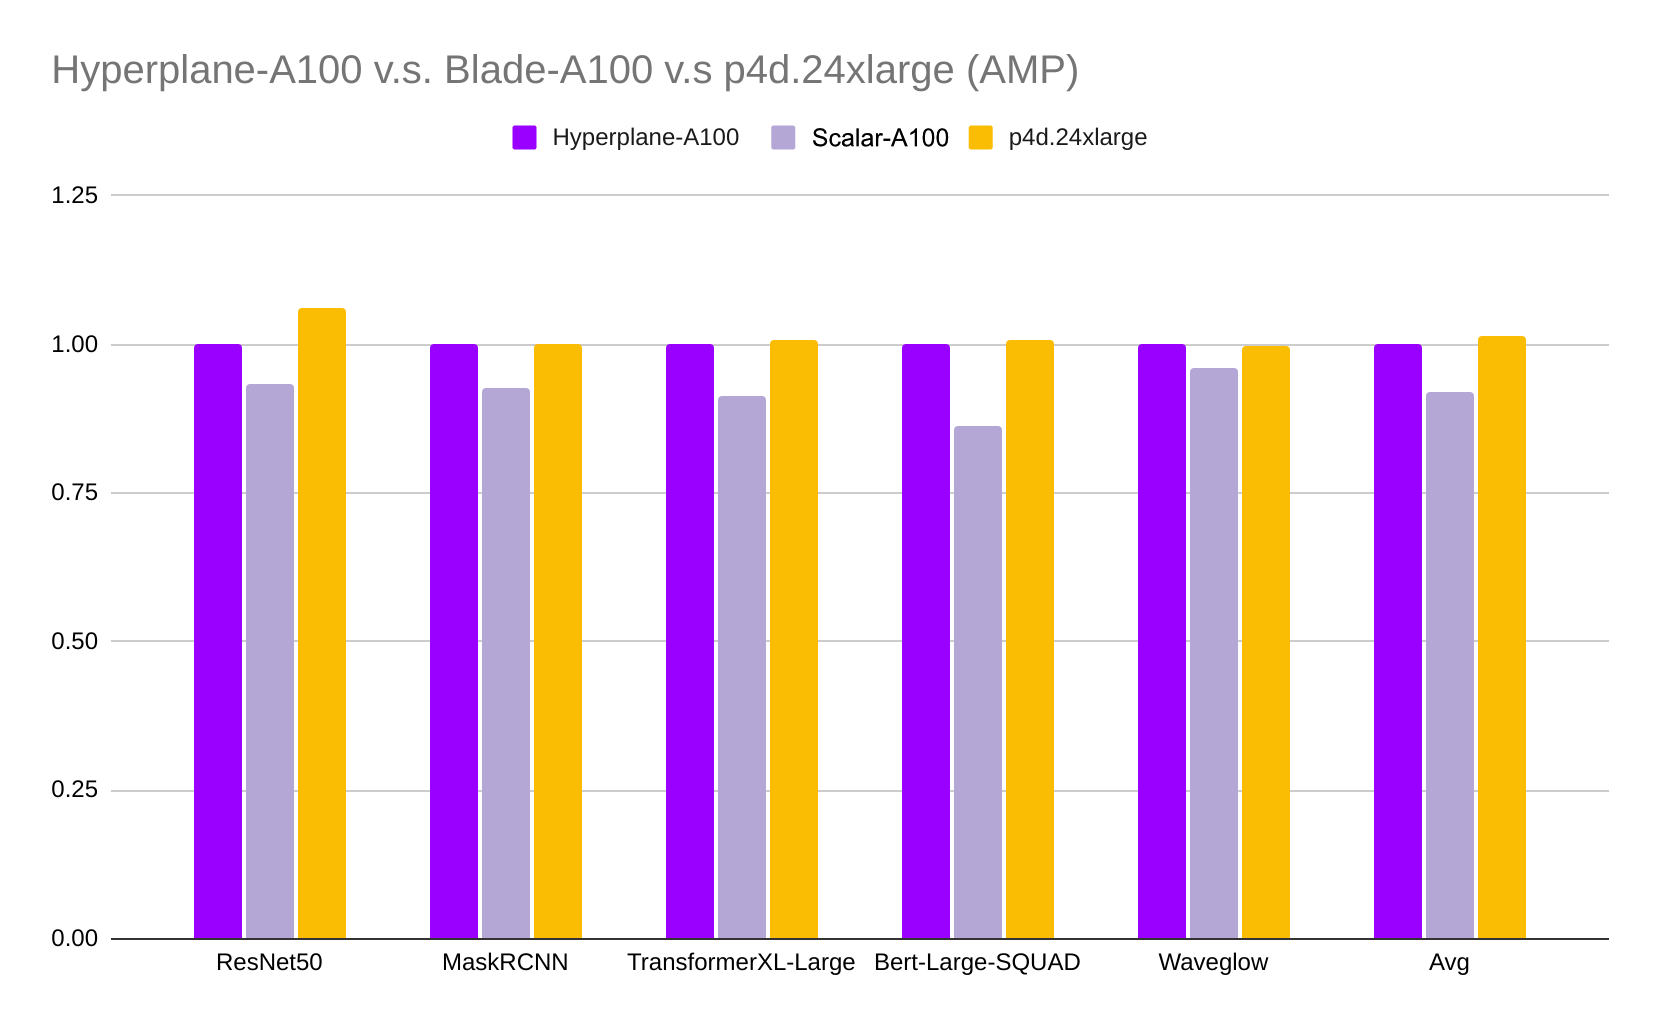
As expected, the Lambda Hyperplane-A100 server and AWS p4d.24xlarge instance deliver similar performance (the averaged difference is less than 1%) since they use similar hardware configurations. Scalar-A100 is about 7.2% and 8.2% slower in TF32 and AMP (Automatic Mixed Precision), respectively, due to its slower GPU interconnection and less power consumption.
Footnotes
1. We think 50% for Power Utilization Ratio is a fair estimation considering most of the time the system didn't draw full power. This is due to factors such as job scheduling, I/O or device-to-device communication bottlenecks, and sub-optimized code.
2. $10,000 per server is generious considering the average salary for a full time data center system administrator is $64,892.
3. We assume a simple linear model and depreciate the value of the server by 25% of its purchase price per year.
4. The cheapest 1-yr reserved plan (all upfront) on AWS is more expensive than the TCO of a Lambda Hyperplane-A100 with 100% annual depreciation rate. Which means you can use less money to buy and operate a Lambda Hyperplane-A100 server for a year and keep the server for free afterwards.
5. Increasing occupancy rate from 50% to 100% will double the total petaflops over a year, but only increase the 1-yr TCO by $10,534 (doubling the electric bill). In consequence the petaflops/$ will increase to 74.5