So you’ve just bought yourself some nice shiny GPUs for your next awesome deep learning project and you’ve got them busily working away for you. You can hear the fans whirring (or maybe you can imagine them whirring in the cloud somewhere), but how can you make sure you’re getting the most out of those GPUs?
In this post, we will look at some tools you can use to keep an eye on your GPUs. Checking on things like their utilization, temperature, and memory usage. We’ll cover how to install them, what they are best at, and some tips on how to use them. By ensuring your GPUs are fully utilized, you can at least ensure they are running your existing models as fast as possible (changing your models to make them as efficient as possible is a topic for another time).
Contents
Prerequisite
- A computer with at least one NVIDIA GPU
- Ubuntu OS 20.04 LTS, 18.04 LTS, or 16.04 LTS
- An NVIDIA driver that matches your GPU type and the desirable CUDA version. You can use Lambda Stack to have a hassle-free, one line installation for CUDA, cuDNN, NVIDIA drivers, and frameworks such as PyTorch and TensorFlow.
nvidia-smi
If you’re using an NVIDIA GPU (and if you’re doing deep learning, the chances are you are) then the most familiar GPU monitoring tool is good old nvidia-smi (NVIDIA System Management Interface). This command line utility tool is installed with the NVIDIA drivers and is probably the monitoring tool that most users are familiar with.
Installation
nvidia-smi is usually installed during the NVIDIA driver installation, though it is a separate package of its own.
Usage
Using nvidia-smi is as simple as typing nvidia-smi at the terminal prompt and you should see output something like the following:
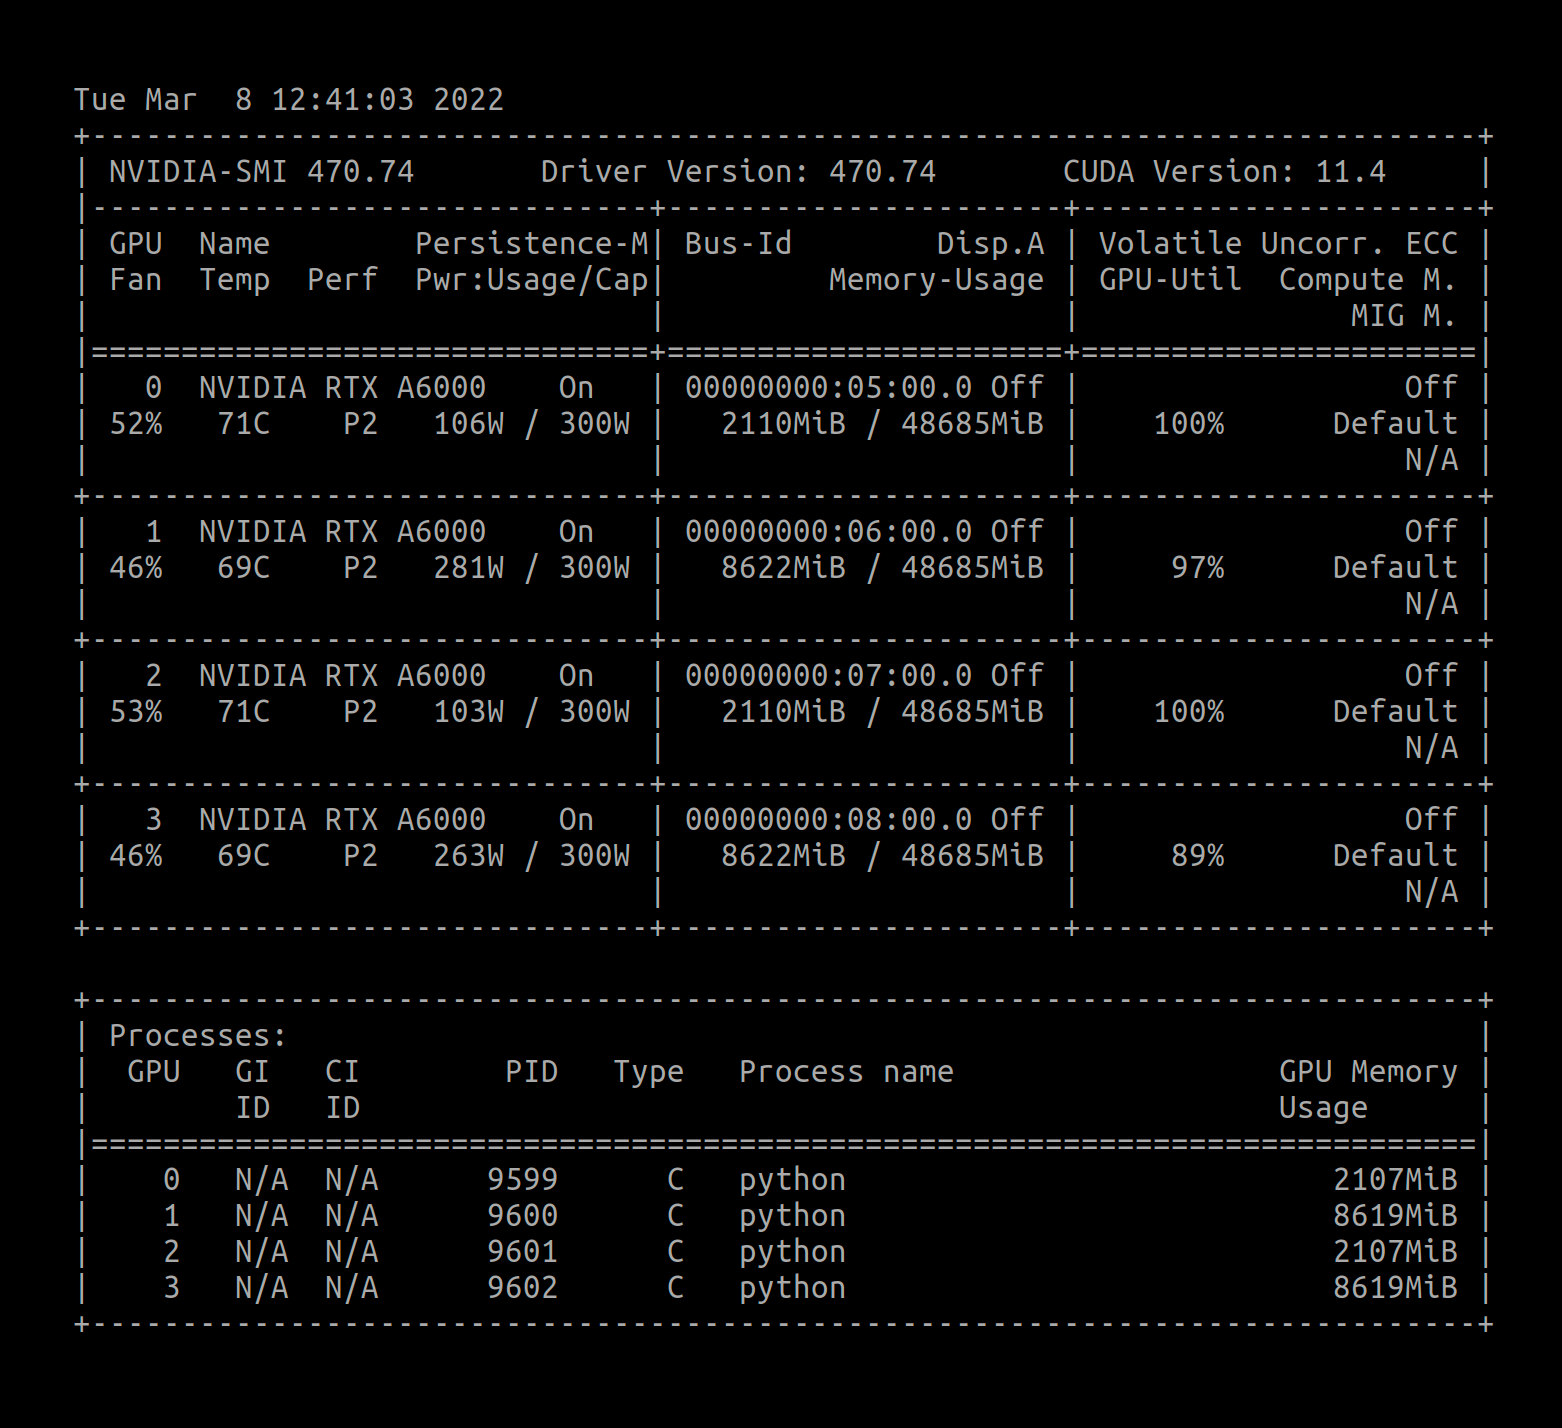
The default output provides a useful summary of your GPU status at a glance. This is great for a quick snapshot of what’s going on, but you can do a lot more with nvidia-smi.
It’s common to want to keep an eye on your GPU utilization over time. nvidia-smi has the option -l to repeatedly display the GPU information for a given time interval. However, I find that using it in conjunction with the watch command gives a nicer output:
watch -n 0.1 nvidia-smi
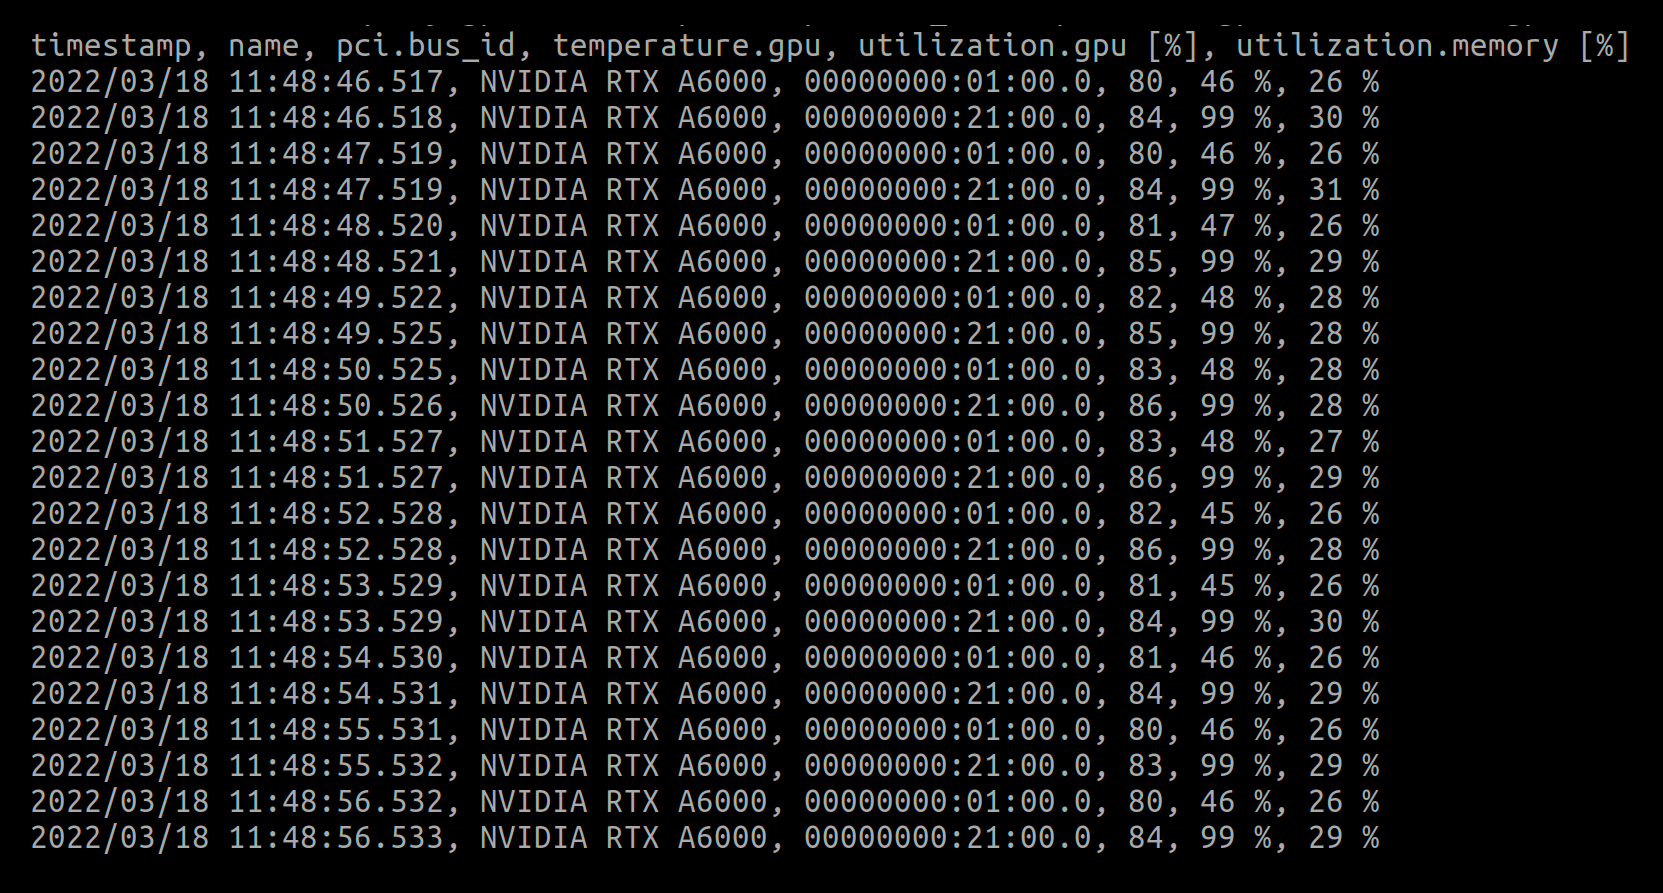
nvidia-smi also allows you to query information about the GPUs and offers a configurable way of setting which parameters to display, and then log them in a machine readable csv format (send this to a file for later analysis using the -f option). Here's an example logging query (see this page for a bunch more):
nvidia-smi --query-gpu=timestamp,name,pci.bus_id,temperature.gpu,utilization.gpu,utilization.memory --format=csv -l 1
There are also dmon and pmon sub-commands which give information on the devices, or processes running on those devices. These are useful for seeing how GPU utilization is varying over time, particularly if you want to export these to files for later analysis. However, if you want a more visual overview of what's going on, you might be better served by other tools on this list.
nvidia-smi -q -d TEMPERATURE,PERFORMANCE shows the preset thresholds to slowdown/shutdown GPUs based on their temperature, as well as whether the current system is experiencing thermal throttling. Typically, if you frequently see HW Slowdown is activated, you probably need to improve the cooling of your machine. This can be achieved by spacing out your GPUs, getting stronger fans or a watercooler for your CPU, or upgrading your chassis. One useful tool to test the thermal performance of your system is to put all your GPUs in stress test using tools such as gpu-burn, and see if the system experiences thermal throttling with the help of nvidia-smi.
nvidia-smi topo -m is a useful command to inspect the “GPU topology“, which describes how GPUs in the system are connected to each another, and to host devices such as CPUs. The topology is important to understand if data transfers between GPUs are being made via direct memory access (DMA) or through host devices.
Finally, nvidia-smi can help you debug errors with your GPUs, system, or settings for power draw, execution mode, and more. See nvidia-smi --help for a complete list.
gpustat
If you’re interested in a more concise, prettier, and simpler alternative to nvidia-smi, a Python library called gpustat is a good option. By default, it prints a single line per GPU with only the most essential information, clearly highlighted for easy reading.
Installation
pip install --user gpustat
Note we’ve installed here using the user flag to install this Python package only for the current user. However, you might prefer to use a tool like pipx to install Python applications in an isolated environment.
Usage
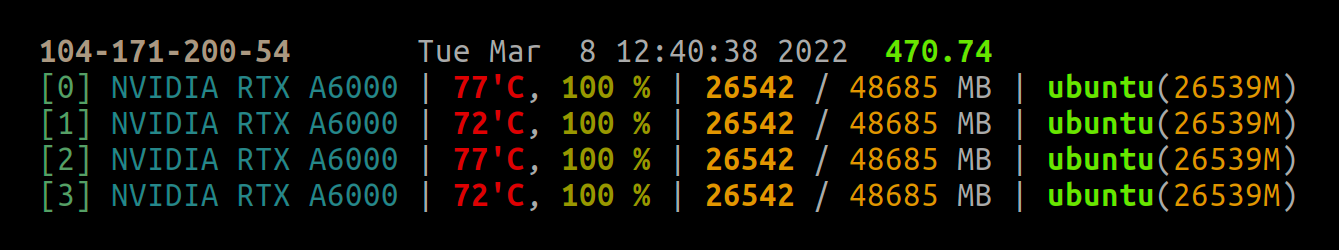
Simply typing gpustat gives a concise, readable summary of your current GPU status:
Gpustat has a few configurable options of what info to display. For example, gpustat -cup will append the command, user and PID of processes on the different GPUs, which is useful if you’re trying to share GPU resources between multiple users without wanting to dive into more elaborate scheduling tools.
Gpustat also comes with the useful --watch command which will run gpustat at a given interval. This is equivalent to running the Linux watch command but saves you having to add the extra commands to preserve the output color.
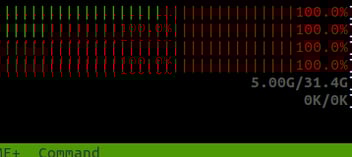
nvtop
If you’re familiar with Linux command line tools, you’re probably familiar with the tools top and htop. These tools give you a real-time dashboard for your system load. nvtop essentially does the same, but for NVIDIA GPUs. With it, you can watch real-time graphs of key information from the GPUs as your training job progresses.
Installation
sudo apt install nvtop
For other systems or to build from source, see the documentation pages.
Usage
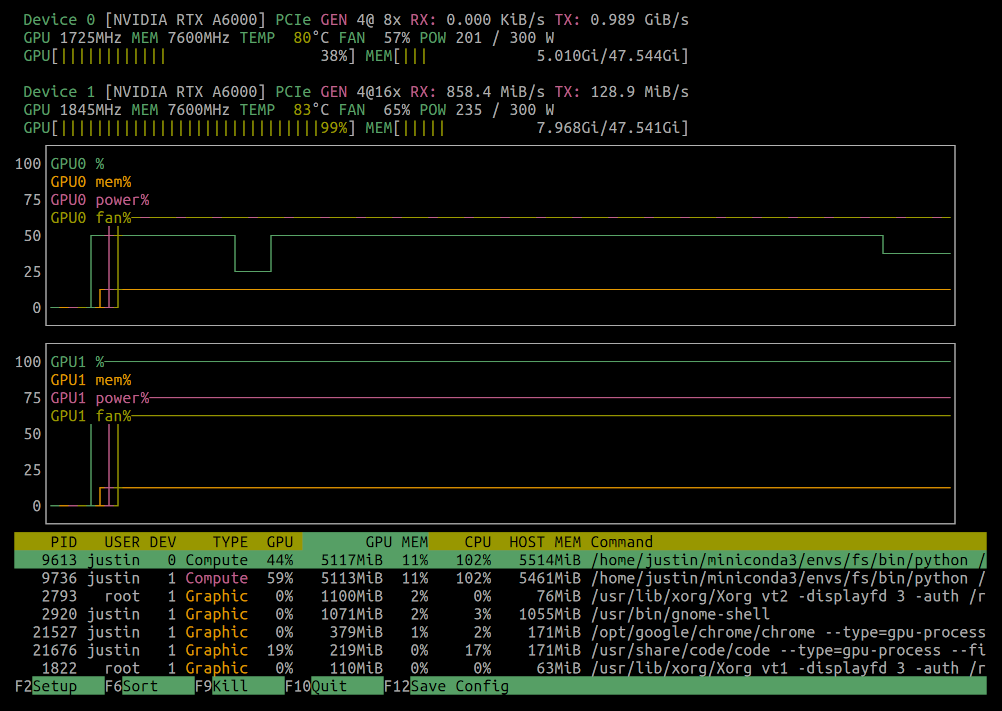
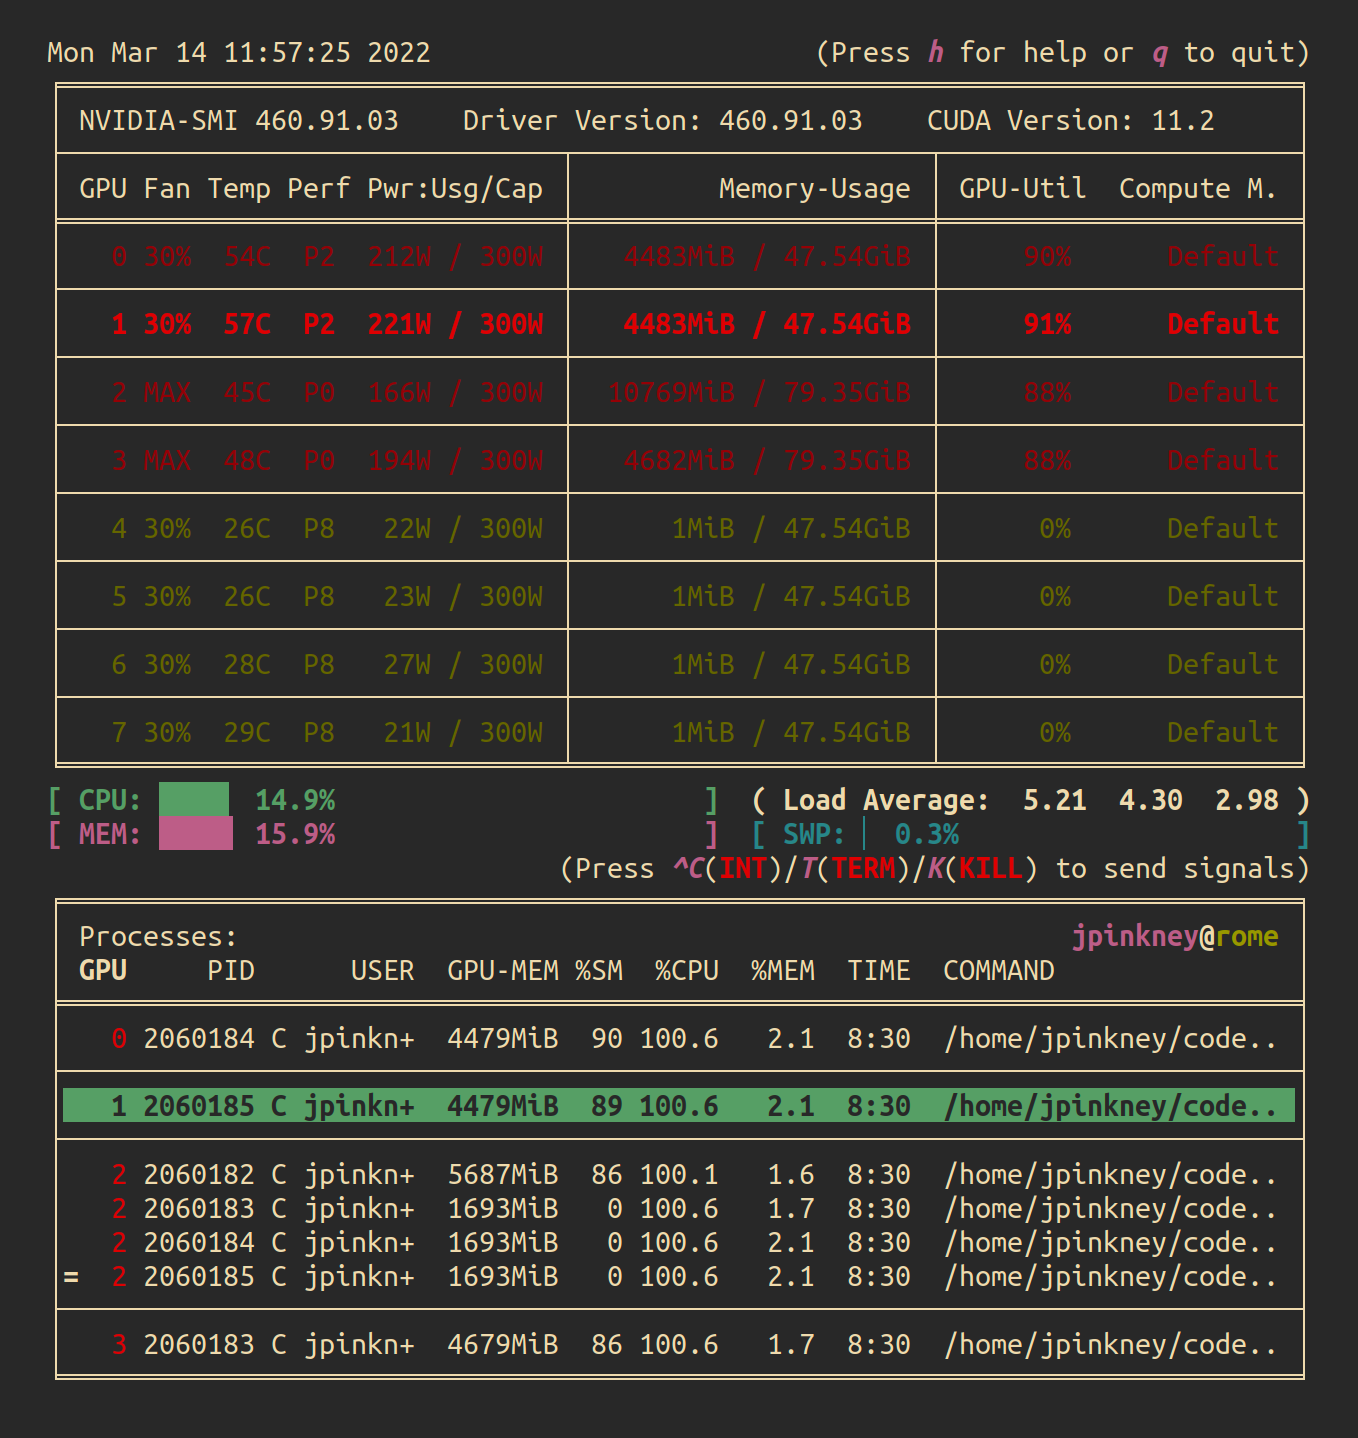
Typing nvtop will bring up the terminal based interface with updating graphs and a summary of what processes are running on your GPUs:
nvtop lets you customize the display: from the information shown in graphs to how processes are sorted and how frequently updates should happen. These can be configured interactively and even saved to disk so that your setup persists between sessions.
nvtop also brings a feature similar to htop: the ability to interactively kill processes from the GUI. This is handy if you wrote some buggy PyTorch DDP code which has hung, or if you’re not so keen on sharing those GPU resources!
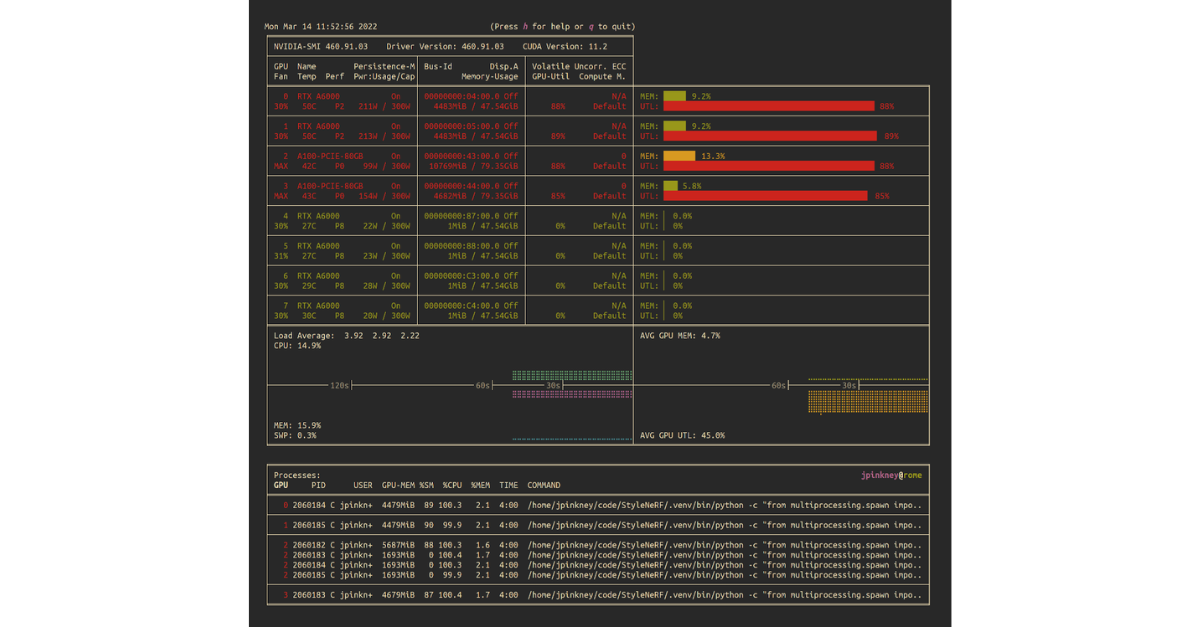
nvitop
nvitop is a tool which combines the information content of nvidia-smi with the nice terminal coloring of gpustat and the interactive monitoring of nvtop. The result is a hugely powerful, information, and aesthetically pleasing tool for monitoring your GPUs.
Installation
pip install --user nvitop
Usage
By default, typing nvitop launches it into monitoring mode which displays a persistent, self-updating screen of GPU info.
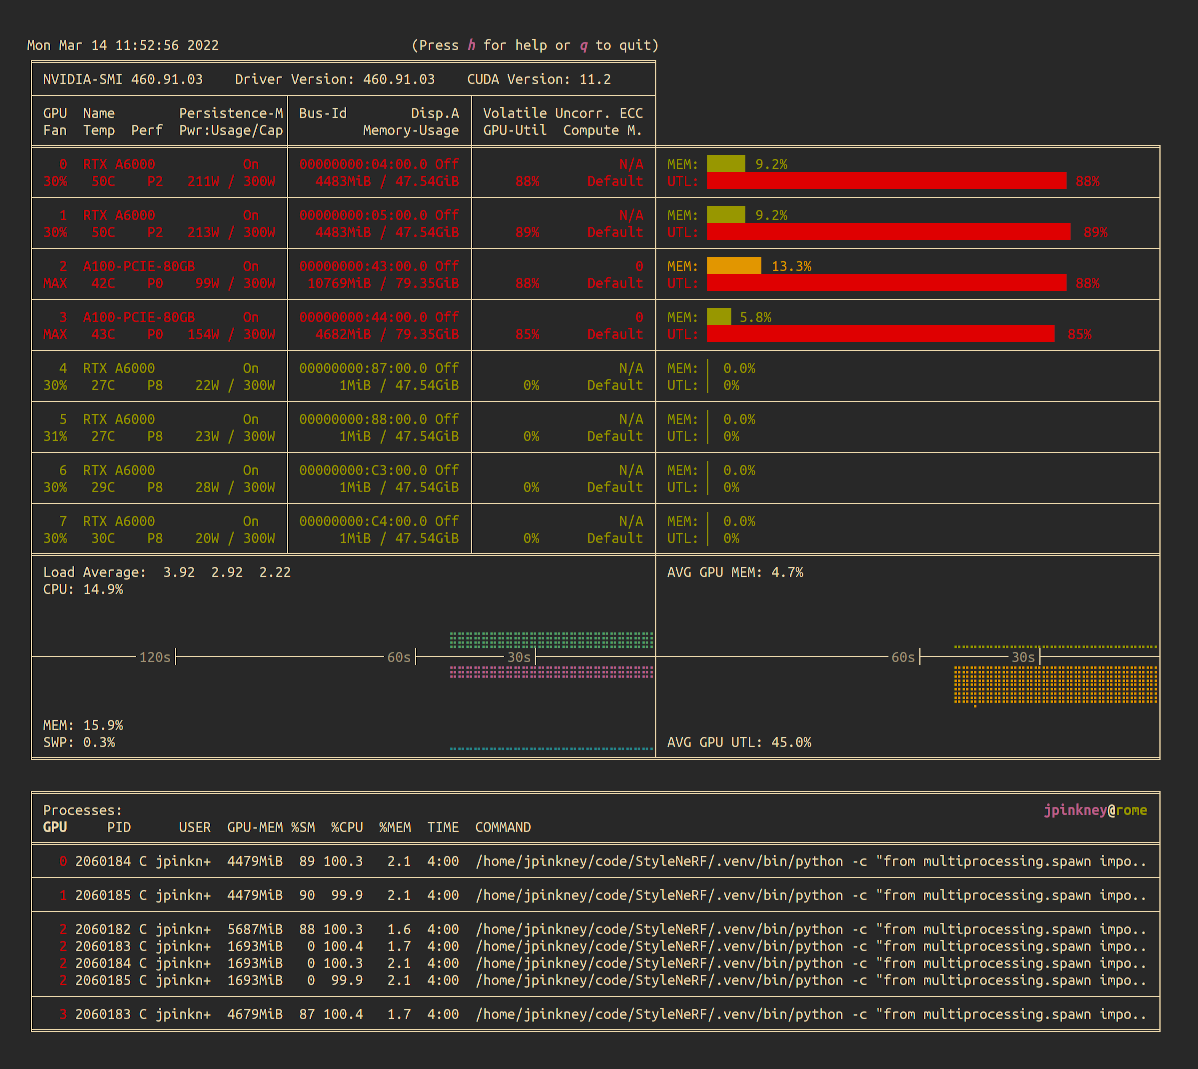
However, if you want to display a one-time output more like nvidi-smi, simply pass the -1 flag, nvitop -1.
Despite being able to show a host of useful information, nvitop is also smart enough to scale itself to the available size of your terminal, reducing the amount displayed to just the bare essentials as needed. Much like nvtop in interactive mode, it allows you to customize the display and interactively sort and kill processes, while highlighting the relevant GPU for any selected process.
Going even further, nvitop provides a Python API with which you can easily query all this GPU information in your own code, and integrates nicely with two popular high level machine learning frameworks: Keras and PyTorch Lightning!
jupyterlab-nvdashboard
If you like working in a Jupyter environment rather than the command line, then the next tool might be the right solution for your GPU monitoring needs. A plugin for Jupyter Lab developed by the rapidsai team, jupyterlab-nvdashboard adds GPU monitoring information to Jupyter.
Installation
pip install --user jupyterlab_nvdashboard
Usage
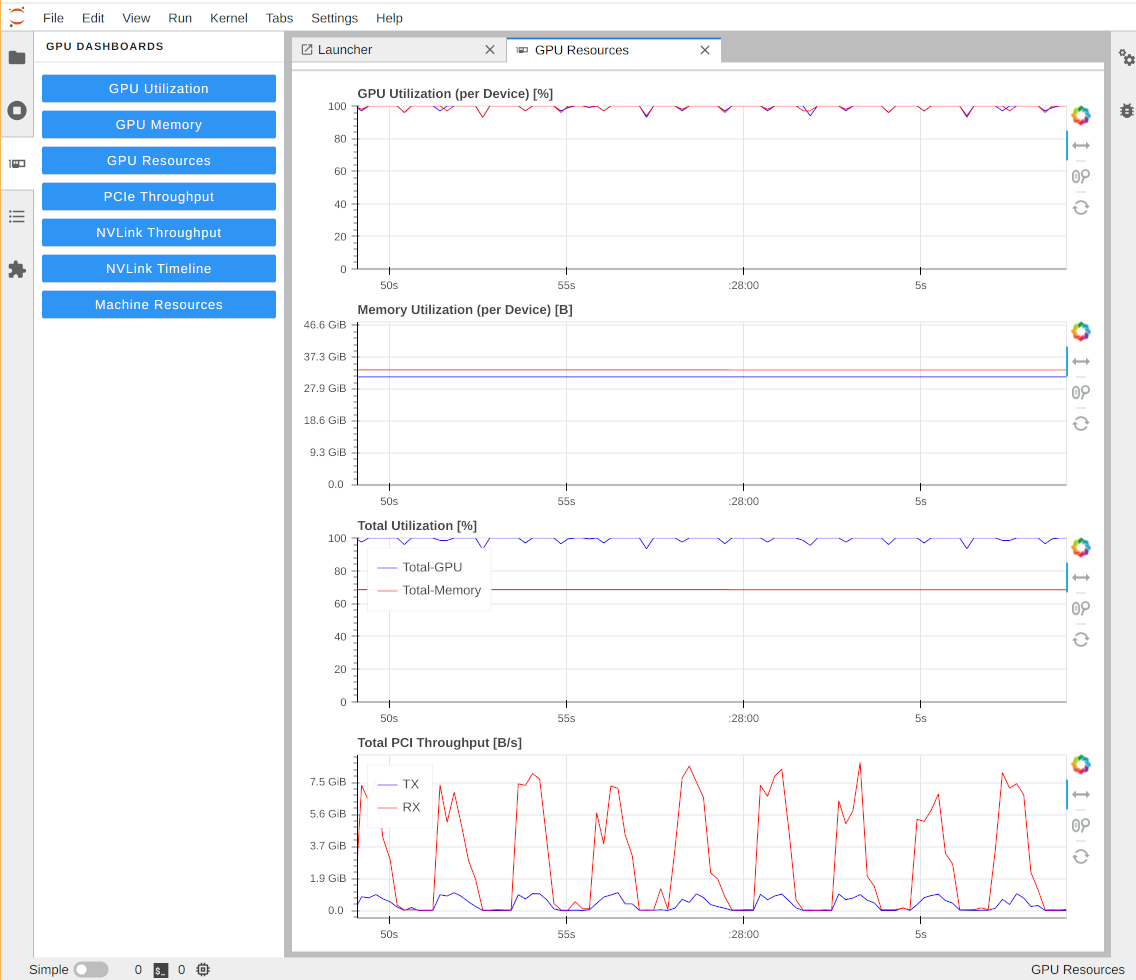
The plugin adds a new tab showing essential GPU statistics in interactive charts directly in your browser. When we tested, we encountered a few intermittent bugs, but the project is under active development and we expect it to evolve into a useful tool.
Others
As well as the tools listed above, there are many other options for monitoring GPU usage. If you're already using a logging library like Weights & Biases, then some GPU monitoring statistics are often built-in by default. For a more in-depth look, see this blog post on Tracking system resources with Weights and Biases.
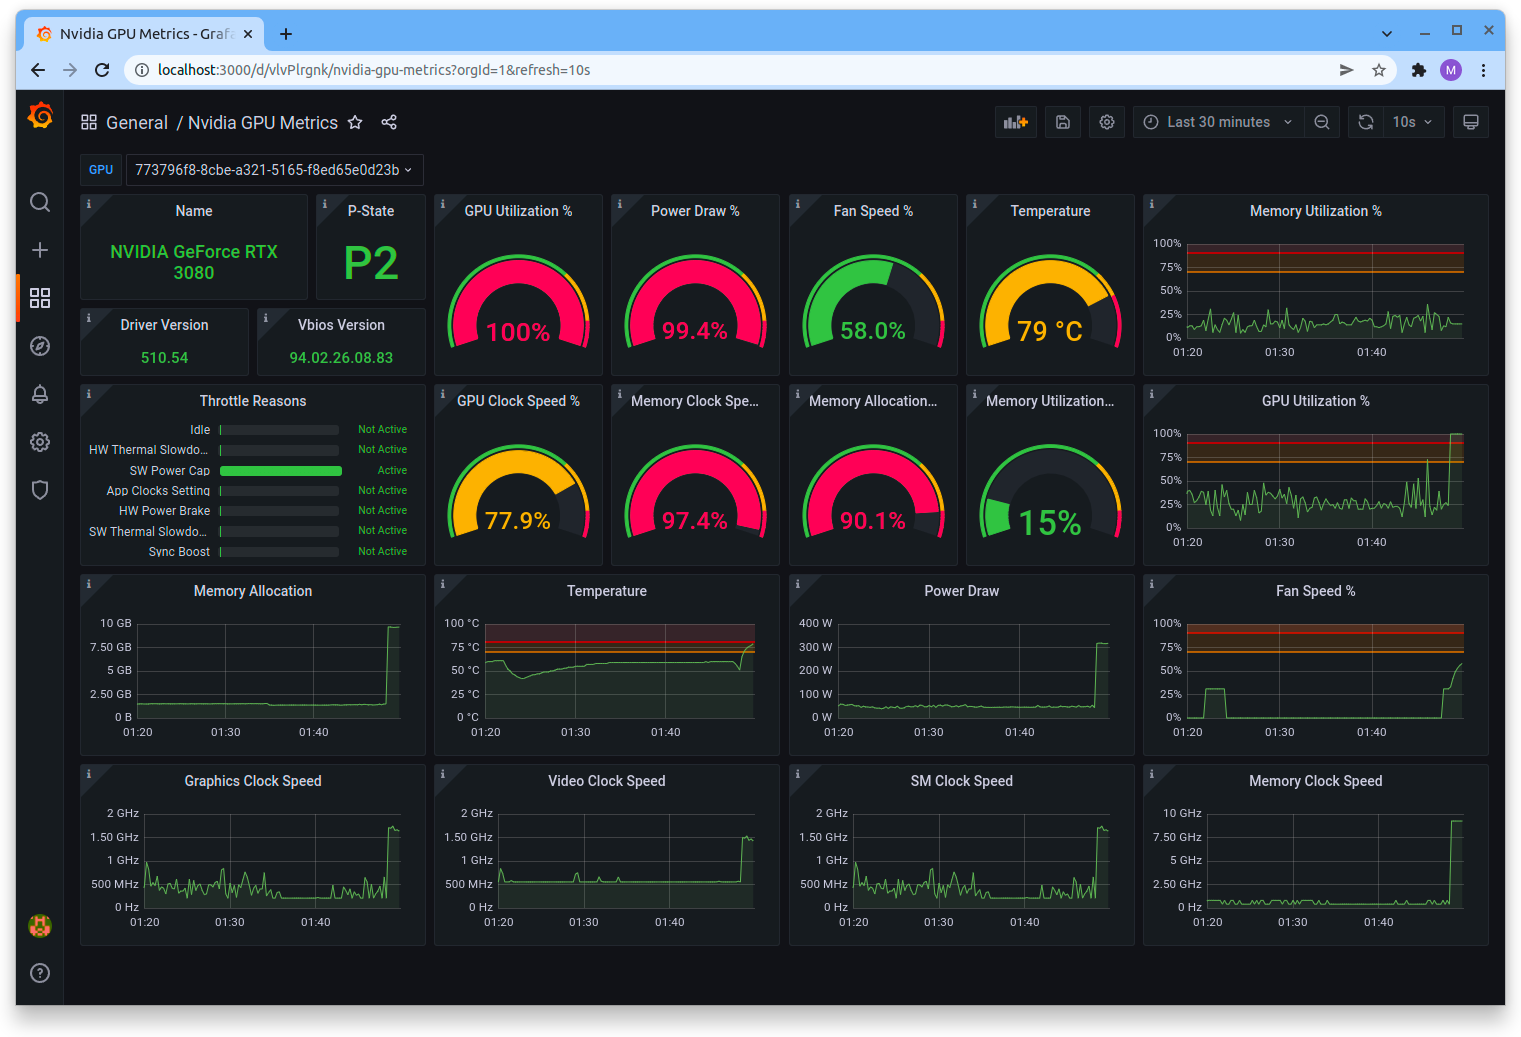
If you’re already familiar with Grafana for monitoring, then you might be interested in the nvidia_gpu_exporter for nvidia-smi which allows you to collect and visualize GPU statistics via a Grafana dashboard.
If you really want to get into the nitty gritty of what is going on in your GPU, there are also fully-fledged GPU profiling tools such as the recently upgraded PyTorch Profiler and NVIDIA’s Visual Profiler. These typically affect the execution speed of your code, so are not things you'll want to use all the time. However, they are useful for seeing exactly what is taking time during your model execution and training.
Finally, you can also get GPU info programmatically in Python using a library like pynvml. With this, you can check whatever statistics of your GPU you want during your training runs or write your own GPU monitoring library, if none of the above are exactly what you want.
Conclusion
In this post, we’ve reviewed many tools for monitoring your GPUs. We suggest nvidia-smi as an essential tool for dealing with NVIDIA GPUs, and suggest using it for typical GPU monitoring, maintenance, and setup tasks.
We think nvitop is currently the best library, with its nice formatting and useful features for day-to-day monitoring of your GPUs. It’s also straightforward to install and use, and comes with handy APIs and integrations.
Finally, if you spend most of your time in Jupyter notebooks, then jupyterlab-nvdashboard may be a good choice for you. It’s still at an early stage of development, but hopefully it will evolve into a robust, feature-rich tool.
We hope we’ve introduced you to some new and interesting options to make your deep learning training a little easier. Happy GPU monitoring!